Modular Playground Manufacturer: $606K to $2.17M in Google Ads Revenue Over Two Years
+258% revenue in two years, while holding ROAS above 16 throughout
Client & Context
A manufacturer of modular outdoor play structures designed for both children and adults, built to hold up across different weather conditions — a durable, all-season outdoor product line.
The Challenge
The account was already generating sales when the engagement began, but the growth engine wasn't scalable: nearly all revenue came from branded search, a channel that inherently caps out once brand awareness plateaus. Branded and non-branded traffic were mixed inside the same campaigns, which caused cannibalization and made it impossible to cleanly read either segment's real performance. Products weren't segmented by category or priority, and part of the budget was going toward ad-to-product matches with weak relevance. The H1 2023 baseline: roughly 195 conversions, $14,166 in spend, and a ROAS of 10.2.
The mandate: don't just grow the budget — build a Google Ads structure capable of systematically scaling sales without a critical drop in efficiency, and hold ROAS at 8+ even as spend rose substantially heading into peak season.
Approach
1. Structural audit discipline
Work on the account was built around a systematic approach and regular review of key parameters, using internal checklists covering search-query analysis, campaign efficiency evaluation, budget-distribution control, bid-strategy analysis, ad-relevance checks, and product-level performance evaluation. This shifted the account from reactive, situational optimization to a regular, repeatable control cycle.
2. Segmentation and campaign restructuring
The team reviewed the account structure and split traffic by key category. Particular attention went to separating branded from non-branded search traffic — this made it possible to properly control the source of each sale, avoid cannibalization between the two, and far more accurately judge each segment's real efficiency. Product-based (Shopping/PMax) campaigns were also restructured around category and priority.
3. A/B testing of ad copy
To lift Search campaign performance, the team ran ongoing A/B tests on ad messaging — testing different phrasing, emphasis and value propositions to improve relevance for specific search queries. This lifted CTR and traffic quality without a constant need to raise acquisition cost.
4. Product title optimization
A dedicated workstream focused on product titles within Shopping and Performance Max — rewriting them so they matched search queries more precisely and described the product more clearly. This raised the relevance of product listings, improved traffic quality, and helped lift conversion rate.
5. Audience and signal management
Customer lists and audience signals for Performance Max were refreshed on a regular basis, giving Google's algorithms more and better-quality data about likely buyers and helping the system find audiences with genuinely similar behavior and a higher conversion probability.
The Seasonality Challenge
A core challenge throughout the project was seasonality. Demand for the client's products is concentrated in the warm part of the year, meaning ad activity had to be scaled up ahead of each season — but scaling too aggressively risked degrading campaign efficiency. Budget increases were therefore calibrated against seasonal demand patterns, actual campaign performance, the potential of specific product categories, the behavior of Google's ad algorithms, and shifts in ROAS and cost-per-conversion. A genuinely important skill throughout was distinguishing temporary performance fluctuation from a real systemic problem — reacting too early to a dip could disrupt a campaign that was still mid-learning-phase.
Results — H1, Year over Year
| Metric | H1 2024 | H1 2025 | H1 2026 |
|---|---|---|---|
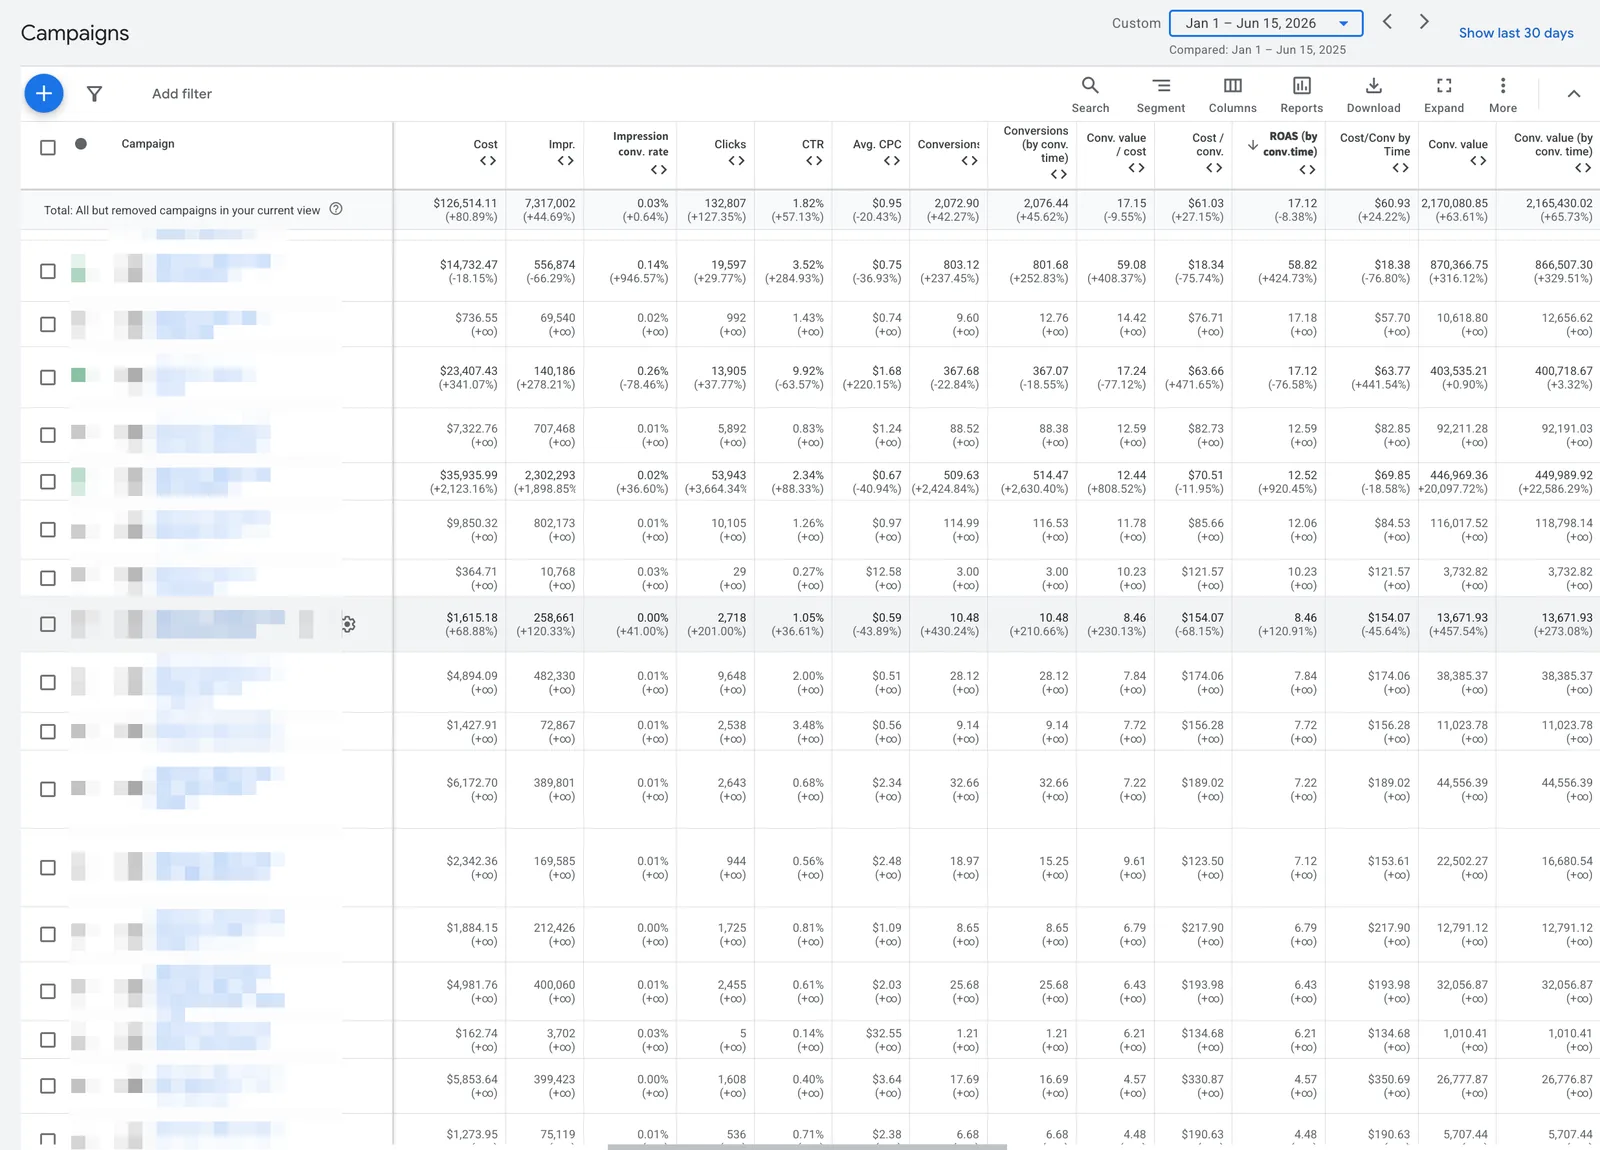
| Revenue | $605,995 | $1,360,657 | $2,170,081 |
| Ad budget | $37,843 | $74,439 | $126,514 |
| ROAS | 16.01 | 18.28 | 17.15 |
| Conversions | 883 | 1,524 | 2,073 |
| Average order value | $685.87 | $893.02 | $1,046.88 |
| Cost per conversion | $42.83 | $48.86 | $61.03 |
Peak Season Snapshot — May 2025 vs May 2026
| Metric | May 2025 | May 2026 | Change |
|---|---|---|---|
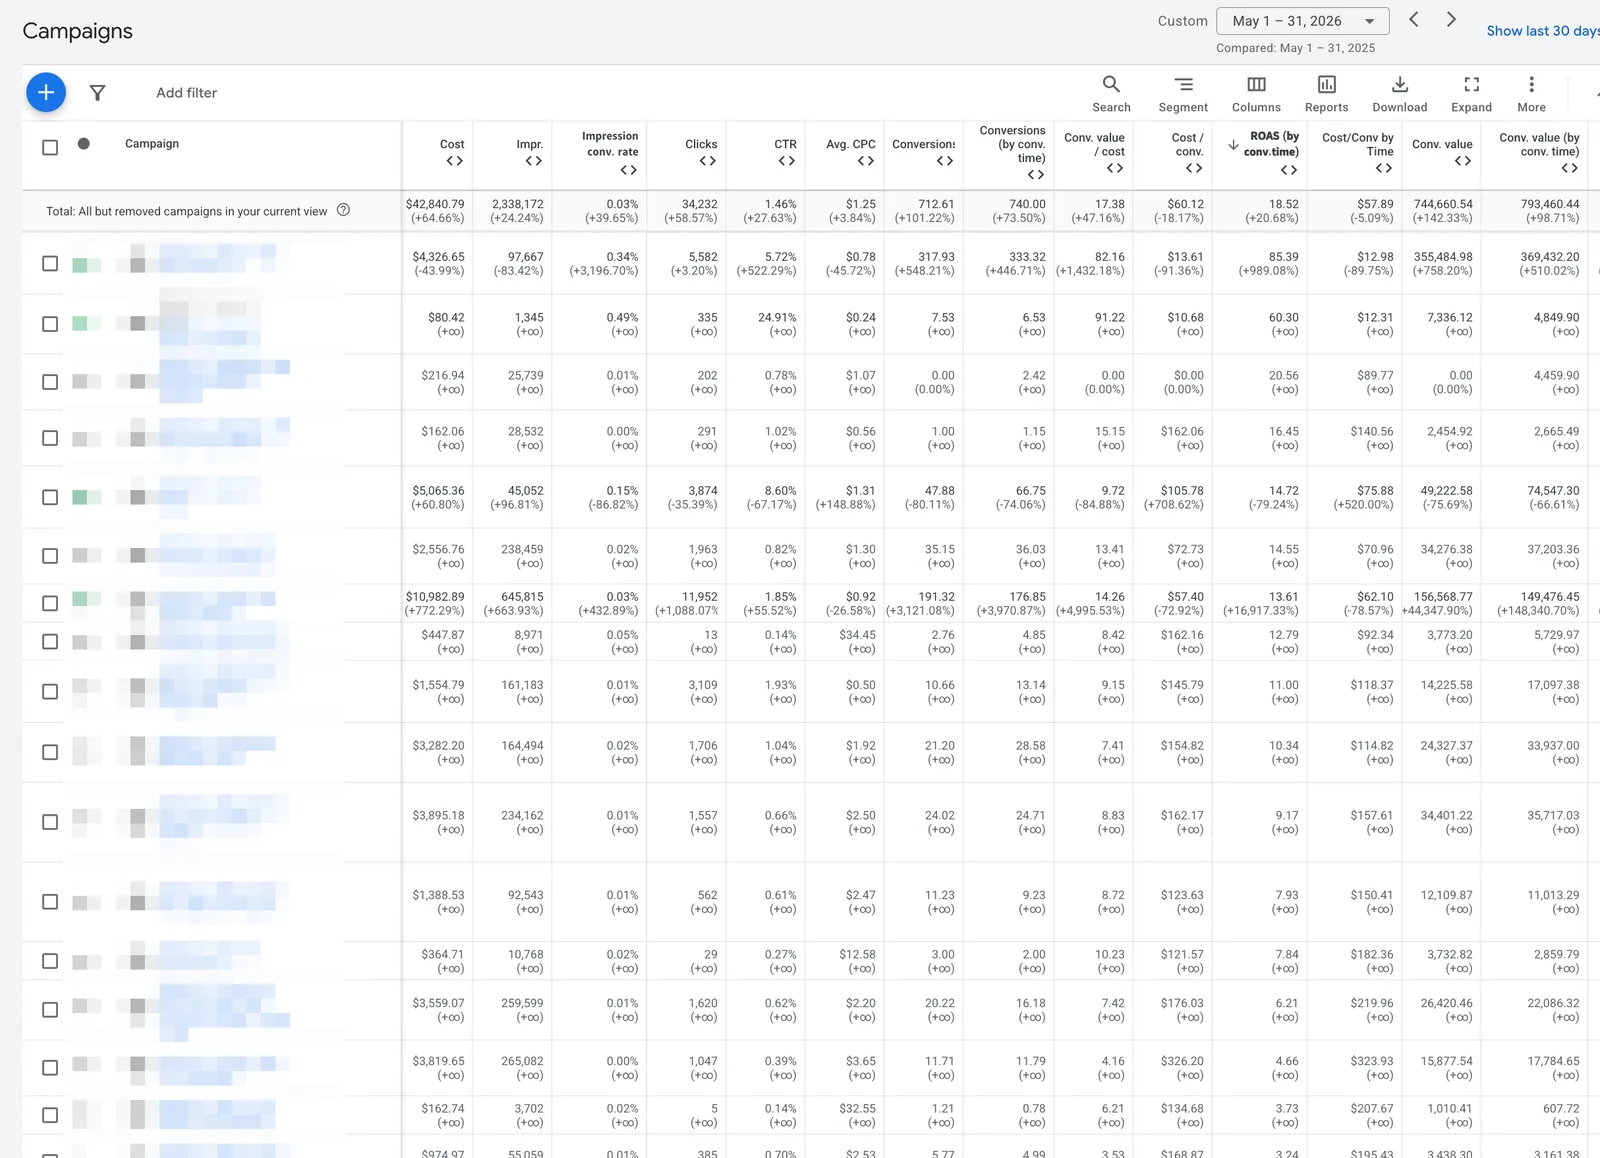
| Revenue | $307,296 | $744,661 | +142.3% |
| Ad budget | $26,017 | $42,841 | +64.7% |
| ROAS | 11.81 | 17.38 | +47.2% |
| Conversions | 354 | 713 | +101.2% |
| Cost per conversion | $73.46 | $60.12 | −18.2% |
Scaling Without Losing Efficiency
Over two years, the H1 ad budget grew more than threefold from $37.8K to $126.5K. Despite that scale, the system kept delivering high ROAS throughout: 16.01 → 18.28 → 17.15. In parallel, revenue grew 258%, conversions grew 135%, and average order value climbed 52.6%. Scaling wasn't driven by budget alone — it came from continuous improvement to account structure, product data, audiences and ad messaging working together.
Best Month on Record
May 2026 stands as the strongest month in the account's entire history: $744.7K in revenue, a ROAS of 17.38, and 713 conversions — despite a 64.7% budget increase, revenue grew more than double, and ROAS still improved rather than eroded under the added spend.
Conclusion
This case shows that scaling Google Ads doesn't have to come with a proportional drop in efficiency. Over two years, ad-driven revenue grew from $606K to $2.17M, and ad spend grew from $37.8K to $126.5K in the same H1 window while ROAS held at a high 17.15. The key levers were structural account optimization, traffic segmentation, continuous A/B testing, product-title optimization, audience-signal management, and disciplined, demand-aware scaling around seasonality.